Methodology
Ansergy runs its 48-hub WECC power price forecast every 30 minutes, out 21 days, We also run a 25-year forecast for the same topology once a day, 7 days a week.
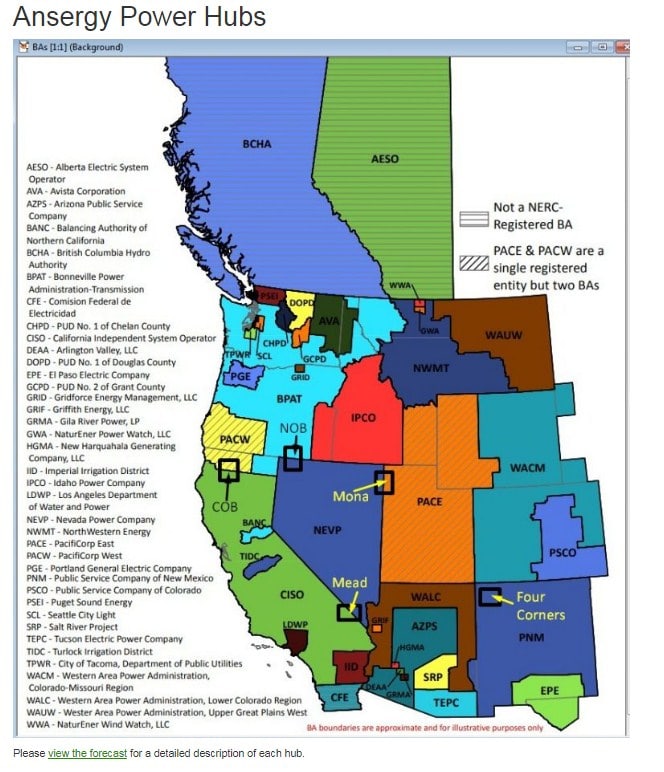
Topology
Our Asset forecasts take those hourly BA-level forecasts and split the various elements (Wind, Solar, Price) by an asset’s MW nameplate rating. We then have hourly forecasts by assets. For gas plants, we know the forecasted heat rate by hour, therefore we can estimate the hours a gas plant will run. Since we know the cost of gas, we know both the gas burned by hour and the cost of that gas. Therefore, we can compute a gross margin by hour.
Asset Mapping
Each asset is mapped to the following:
Data Fields
- Asset ID – an internal id used by Ansergy
- Date – forecasted date
- Hour – forecasted hour
- Generation (MWH) – forecasted power plant output in mwh
- Power Price ($/mwh) – Ansergy’s forecasted price for that asset’s hub in $/mwh
- Nat Gas price ($/mmbtu) – Ansergy’s forecasted nat gas price in $/mmbtu
- Heat Rate (btu/kwh) – Computed heat rate (Power Price / Gas Price)
- Revenues ($) – MWH * Power Price
- Gas Burn (mmbtu) – for gas plants only, heat rate * MWH
- Gas Cost ($) – Gas Burn * Gas Price
- Gross Margin ($) – Revenues – Gas Cost
The data is refreshed about every three hours, though we could refresh every thirty minutes upon request. This sample data output can be customized and delivered via API upon request. To learn more about Ansergy, please visit our website – Ansergy WECC.
Michael Griswold, CEO
[email protected]
+1 206-877-0991