Features of Ansergy Forecasts
- Continuous updates – Ansergy forecasts are stored in the cloud where its models run 24/7. Ansergy currently deploys ten servers, each with a unique purpose. Four of these servers are solely dedicated to scraping and archiving data which is used in the 5-Year Forecast.
- Web Interface – access all forecasts via the web or API. Download forecast data or create custom charts for easy viewing. Create custom dashboards to quickly view the reports that are essential to you. Ansergy provides you with easily digestible analytics.
- Transparent – No black box here, all clients are given complete access to Ansergy’s proprietary algorithms.
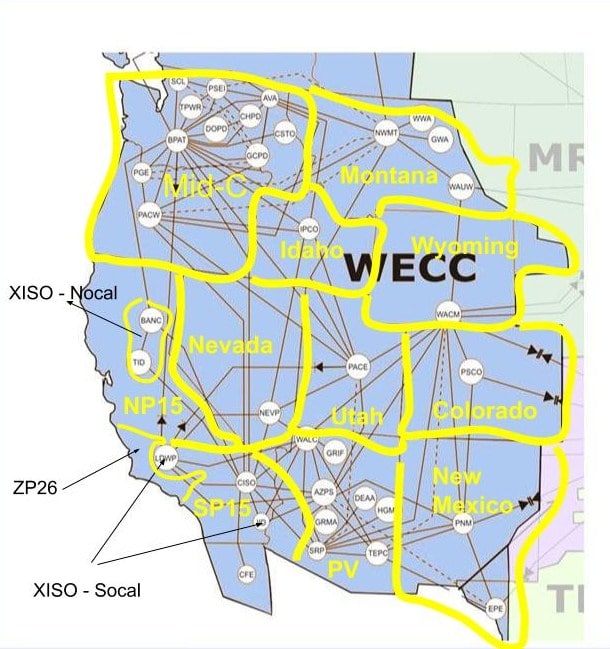
- Topology
The Model
Ansergy uses a proprietary hourly production cost model (EGO – Electric Grid Optimization) deployed against its 14 hub topology. The model includes unit-level dispatch rules (Min. Up/Down) along with various internal optimization features for hydro, pumped storage, and batteries. Each hour is modeled using the firm’s latest forecast inputs and outputs (see below), and is then archived and uploaded to the website.
Inputs
- Demand – Hourly forecast at a Balancing Authority level then aggregated to hub level.
- Demand forecasts use the most recent hourly temperature and humidity forecasts out fourteen days.
- Utility level forecasts upon request.
- Hydro
-
- Forecast hourly at an aggregated plant level. Forecasts (plant-level) include water supply, stream flow, spill, and energy.
- Wind
-
- Hourly forecast at an aggregated plant level using most recent wind speed forecasts out fourteen days. Forecast based upon current capacity net of outages. Beyond fourteen days, a ten year hourly average wind speed adjusted for forecasted new generation is used.
- Solar
-
- Hourly forecast at an aggregated plant level using most recent cloud cover forecasts out fourteen days. Forecast is based upon current capacity net of outages. Beyond that, we use a ten year hourly average wind speed adjusted for forecasting new generation.
- TTC
-
- Incorporates most recent TTC derates per BPA, ISO, and OATI. Forecasts beyond that incorporate ten-year average derates.
- Fuels
-
- Natural Gas – daily gas price forecasts reflecting most recent basis (Previous Day) adjusted for real time Nymex prices.
- Coal – most recent EIA prices.
- Capacity
- Dynamic genstack updated monthly using EIA; outages include Gas nominations, ISO, and other derived sources. Long-term outages based upon historicals including CEMS, ISO, and NERC GADS data.
Outputs
All EGO (Electric Grid Optimization) output is hourly at a hub level. Inputs (See above) are also hourly but at a finer aggregative level. Outputs include the following:
- Price
- Measured in $/mwh
- Heat Rates
- Both market and model heat rates
- Spark Spreads
- All types
- Emissions
-
- SOX, NOX, and CO2
- Transmission Flows
-
- 30 hub to hub lines, hourly flows
- Reserve Margin